
Graduation Gaps: Examining Inequities in New Hampshire’s Public Schools
June 2025
Carly Prescott, MPP
Introduction
High school graduation is more than a milestone; it measures how well a public school system supports its students through to completion. Graduation rates offer critical insight into who our schools serve, how effectively they’re doing it, and where students may fall through the cracks. In New Hampshire, where education funding varies widely from town to town, graduation data helps reveal the deep inequities between communities. This paper takes a closer look at high school graduation rates across the state, using them as a lens to understand disparities, track trends, and consider what they tell us about the populations our schools are designed to serve.
The timing of this analysis is also significant. The National Center for Education Statistics, the federal agency that once tracked national graduation rates, was shuttered in March 2025 by the second Trump Administration, limiting access to consistent national data going forward. That makes state-level data even more important.
The data in this report comes from the New Hampshire Department of Education, which defines the graduation rate as the percentage of students who graduated after 4 academic years.
Class of 2024 Public High School Graduation Rates
Graduation rates across New Hampshire high schools vary widely, underscoring stark differences in the student populations served and the capacity of schools to support all learners. While more than 20 schools (including Sunapee, Hopkinton, and Lisbon) achieved graduation rates at or near 100%, others, such as Manchester Central (69.97%), had significantly lower rates. These disparities often reflect deeper structural inequities: schools with lower graduation rates tend to serve larger populations of economically disadvantaged students, English language learners, and students requiring additional supports.
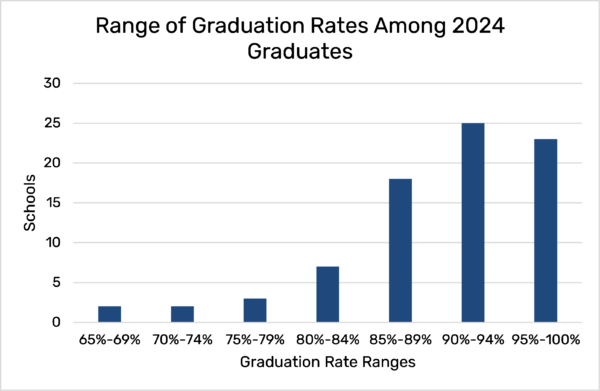
Figure 1 shows the distribution of graduation rates among all New Hampshire public high schools for the Class of 2024. Each bar represents a range of graduation rates, and the height of the bar indicates how many schools fall within that range. These rates reflect the percentage of students who entered 9th grade in fall 2020 and graduated within four years, by spring 2024.
Figure 1
Graduation Rates and Small High Schools
There is a natural statistical variation from year to year, and this is particularly true in smaller high schools, so the use of single-year graduation rates for schools does not show the full picture.
Groveton High School’s average graduating class size has been fewer than 28 students during the past eight years. Its graduation rate of 73.2% for the Class of 2016 was followed by 93.8% for the Class of 2017, a difference of more than 20%. The graduation rates of that high school and other small schools should not be judged by any single year.
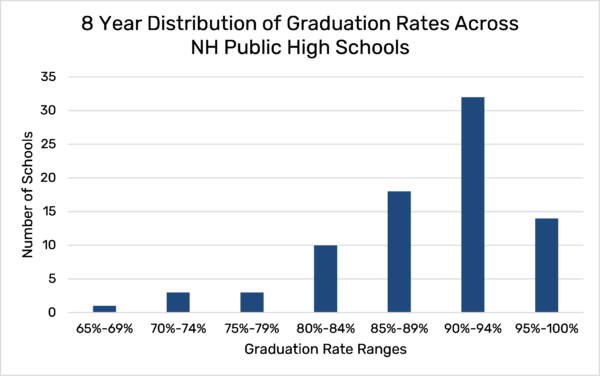
Eight-year averages of high school graduation rates help to smooth out these annual variations. The classes of 2016, 2017, 2018, 2019, 2020, 2021, 2022, 2023, and 2024 represent the most recent complete data available.
Figure 2 displays the distribution of high school graduation rates across New Hampshire over eight years. By using data from multiple graduating classes, this view smooths year-to-year fluctuations and offers a more stable picture of the data across schools. Smaller schools, which may see wider swings in annual rates, are more equitably represented when viewed across this longer period.
Figure 2
Impacts of the COVID-19 Pandemic on Graduation Rates and NH High Schools
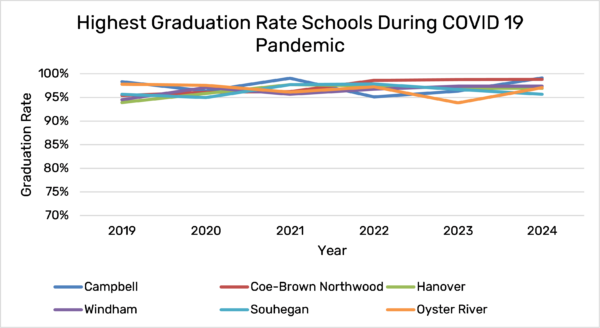
Despite the widespread disruptions caused by the COVID-19 pandemic, New Hampshire’s high schools with the highest graduation rates maintained their extremely high rates from 2019 through 2024. Schools like Campbell, Coe-Brown Northwood, and Hanover consistently posted graduation rates above 95%. While some schools experienced temporary dips, such as Windham and Hanover in 2020, these declines were modest and short-lived. Oyster River saw the most noticeable fluctuation, dropping from 97.24% in 2022 to 93.85% in 2023, before rebounding to 97.06% in 2024.
Overall, by 2024, all six schools had recovered or exceeded their pre-pandemic graduation rates, suggesting that these districts were able to effectively support students through disruptions. Their resilience may reflect strong community resources or effective remote learning and student support systems that helped mitigate the academic and social impacts of the pandemic.
Figure 3
In stark contrast to the state’s highest-graduation rate schools, several of New Hampshire’s lowest-graduation-rate high schools experienced significant volatility and consistently low rates between 2019 and 2024. Schools like Manchester Central and Manchester West hovered around 70%, with only modest improvements over time. Manchester West, for example, dropped to just 56.4% in 2021 and has since climbed back to 70.41% in 2024, still far below state averages.
Figure 4
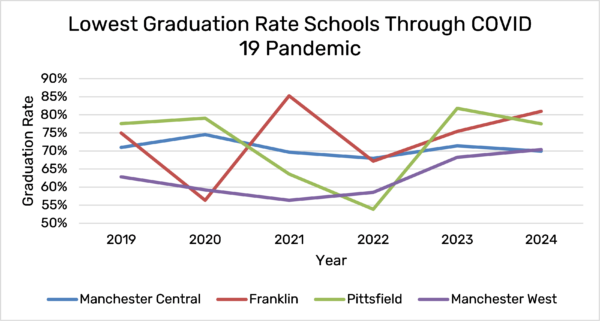
Franklin High School experienced significant fluctuations, dipping to 56.3% in 2020 and peaking at 85.2% in 2021, indicating instability rather than upward momentum. Pittsfield saw a sharp decline during the pandemic, dropping to 53.85% in 2022, but rebounded to 77.5% by 2024, although its trajectory remains inconsistent.
These patterns suggest ongoing structural challenges, such as concentrated poverty and limited student support that have impeded consistent educational outcomes. In contrast to the state’s top-performing schools, recovery in these districts seems fragile or incomplete, emphasizing the inequities in how the impacts of the pandemic were experienced and addressed.
Graduation Rates and Socioeconomic Factors
Several factors can impact a high school’s graduation rate. Socioeconomic factors such as increased levels of poverty (as measured by the rates of Free and Reduced-Price Lunch Eligibility) and the taxable property value in a community can provide valuable insights into performance measures.
Figure 5
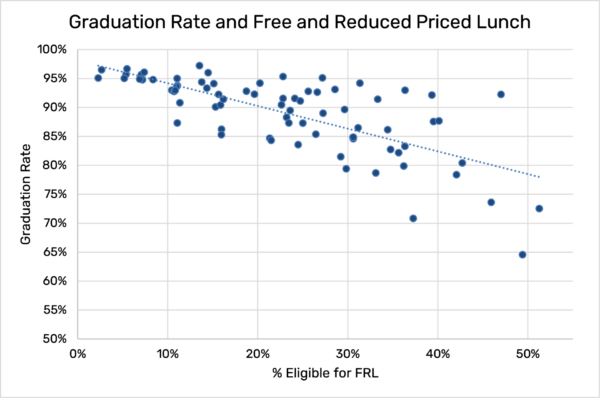
Figure 5 illustrates a correlation between the percentage of students eligible for free and reduced-price lunch and high school graduation rates throughout New Hampshire. Generally, schools with lower percentages of economically disadvantaged students have higher graduation rates. For instance, Windham High School has a free and reduced-price lunch eligibility rate of just 2.66% (the lowest of any high school) and a graduation rate of 96.52%, while Manchester West High School has an eligibility rate of 49.41% (the highest in the state) and a graduation rate of 64.59%.
However, notable exceptions exist. Schools like Littleton High School and Hinsdale High School serve student populations with high levels of economic need, yet still maintain graduation rates above 90%. These outliers indicate that while economic disadvantage is strongly linked to graduation outcomes, other factors such as school-level support or community context may also influence student success.
Figure 6
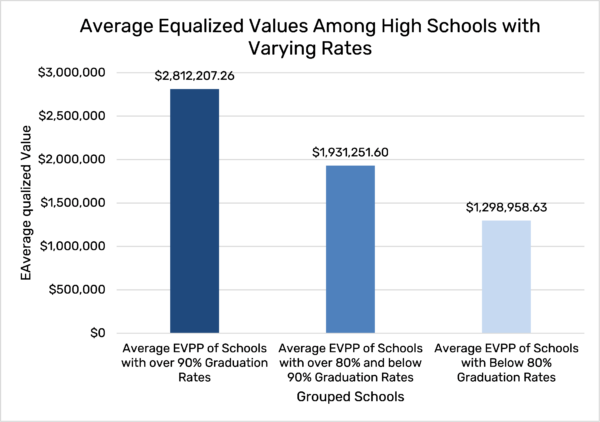
Figure 6 reveals a general trend in New Hampshire public high schools where higher equalized valuation per pupil (EVPP)[1] often aligns with higher graduation rates. For instance, Moultonborough, with one of the highest valuations per pupil at nearly $15 million reports a graduation rate of 90.48%, while schools like Pittsfield and Franklin, with valuations below $1.3 million, have significantly lower graduation rates of 70.85% and 72.53%, respectively.
However, some schools like Hinsdale and Littleton maintain strong graduation rates above 90% despite lower property wealth. Conversely, Manchester West, with modest valuation levels, has the lowest graduation rate in the state at 64.59%. These variations suggest that while community property wealth plays a role, poverty’s prevalence has a more direct impact on lower graduation rates.
Comparison to the Nation
The National Center for Education Statistics (NCES) collects data from every state and publishes summaries and analyses. NCES requests that states use a common set of definitions about what constitutes graduation. The reported graduation rate is the percentage of students who entered grade 9 and graduated at the end of 4 school years, known as the 4-year “adjusted cohort rate.” By using this common definition, we can compare New Hampshire to other states.
The most recent data from NCES is for the Class of 2021, and the office has since been closed by the Trump Administration. New Hampshire’s rate that year was 87% while the national average was 85%. The fact that New Hampshire graduated students at a higher rate than the national average is certainly a positive statement. New Hampshire was 22nd among the states.
But it is also important to acknowledge that our average does not represent the situation in all of our public high schools.
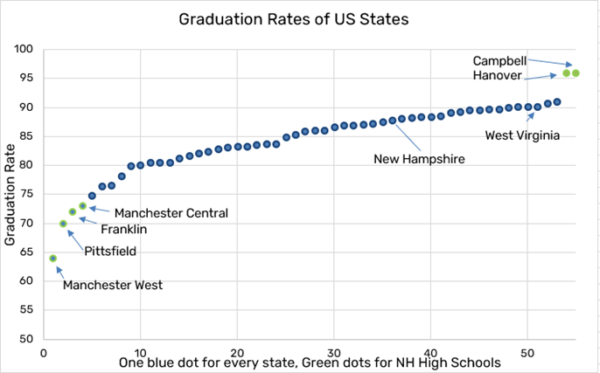
Figure 7 shows four of our public high schools with graduation rates below all other state averages, and two above all other state averages. The District of Columbia had the lowest rate, 75%, in 2021, while Alabama had the highest, 91%.
Figure 7
Conclusion
New Hampshire’s graduation rate data highlights the deep and persistent inequities in our public education system, which are closely linked to how we fund our schools. The contrast between consistently high-performing schools and those with low or unstable graduation rates is not coincidental. It reflects a system where students’ educational opportunities are influenced by their community’s property wealth, rather than their potential. Schools in better-funded districts have managed to withstand disruptions like the COVID-19 pandemic and maintain strong outcomes, while under-resourced schools continue to struggle, often lacking the staffing, programs, or support necessary to help all students graduate.
Even as New Hampshire’s statewide average graduation rate remains above the national average, this broad metric conceals disparities between communities. Averages cannot convey the reality of places where one in three students doesn’t graduate on time in four years, or where rates fluctuate dramatically from year to year because small schools lack stable resources. The truth is that our funding model creates winners and losers, and our most vulnerable students are paying the price.
As the state continues to debate education funding reform, these graduation rate patterns must be part of the conversation. They are not just reflections of school performance; they provide evidence of the consequences of an unequal system. If we want to ensure that every student in New Hampshire has a fair shot at success, we must tackle the funding inequities that continue to divide our communities and impact educational outcomes.
Download a copy of this report
[1] EVPP represents the total taxable property available on a per-pupil basis. It measures a community’s capacity to raise funds for schools.