
Advanced Placement (AP) is a level of high school course that if completed successfully, can provide students with credit for post-secondary education. AP courses are often the highest level of coursework a high school student can take. Depending on teacher recommendation, performance, and grades, students can enroll in AP-level courses. For students applying to college and university, AP exams can help students save time and money in their future academic endeavors.
AP courses and opportunities for AP credit are not equitably available to all NH students. This report seeks to understand the patterns in New Hampshire’s AP exam takers.
Key Findings:
- On average, 10.6% of students enrolled in NH’s public schools took at least one AP Exam.
- On average, each test taker took 1.58 exams.
- 69.1% of exams taken scored a 3 or higher.
- Windham High School had the most successful exams per 100 students.
- Schools with a lower percentage of low-income students have greater participation in AP courses and exams.
- Larger schools have more successful exams on average.
- Schools with an equalized value per pupil over $1,000,000 yielded higher AP scores on average.
Background
The College Board offers Advanced Placement (AP) exams every May to students in the United States. The exams are typically the culmination of students’ participation in Advanced Placement courses in their high school.
There is no requirement for New Hampshire high schools to offer AP courses, although most public high schools do offer at least one such course. There is also no requirement that students take an AP course. Among those who do, there is no requirement to take that course’s exam at the end of the year. About 11% of NH public high school students do take at least one AP exam each year.
An important aspect of AP courses is that they are authorized at each school by the College Board after ensuring that the school and teachers understand the standard syllabus and materials recommended for use. This ensures that each AP course at each school is working toward the same learning goals and that students will be tested against those goals.
One purpose of the courses and the exams is to allow students to get college credit in advance of entering college, thus potentially skipping certain college courses. There are 38 subjects, each with its associated standardized exam, including Microeconomics, Calculus, English Literature and Composition, Art History, Japanese Language and Culture, United States History, Human Geography, Psychology, Studio Art: 3-D Design, Biology, and Computer Science.
Each AP exam is graded on a scale from 1 to 5. The official definition of each score is:
5 – Extremely Well Qualified
4 – Well Qualified
3 – Qualified
2 – Possibly Qualified
1 – No Recommendation[1]
Most colleges grant advanced credit based on these tests, although some do not. Each college decides what score is required to obtain credit at their institution. Regarding the AP Chemistry exam, for example, the University of New Hampshire requires a score of 3 to obtain advanced credit while Saint Anselm College requires a score of 4 and Dartmouth requires a score of 5.[2]
The College Board publishes results for each public high school in each state. The reports for New Hampshire schools can be found on the NH Department of Education website.[3] For each school, the report lists the number of unduplicated students who took at least one AP exam, the number of exams that were taken (some students may take more than one), and the number of exams that were scored 3 or higher, which we designate as “3+”.
Summing Results Over Multiple Years
AP courses are offered at each high school and the number of students taking such courses can vary from year to year. This is especially true of smaller high schools. We have summed the numbers over the four years of 2018, 2019, 2020, and 2021. This dampens any year-to-year variations and allows a fairer comparison among schools.
Table 1

Table 1 displays statewide numbers and averages. Between 2019 and 2021, the number of students taking AP exams declined by 10% while enrollment declined by only 2%. This is most likely related to the Covid-19 epidemic and the difficulty in maintaining AP courses during periods of remote learning.
During the four-year period, 10.6% of students statewide took at least one AP exam.
Differences in Participation in AP Exams
The number of students who take AP exams is determined by several factors. Most obviously, students who do not plan to attend college after graduation have no reason to take an AP exam. For those who do plan to attend college, some high schools offer more such courses than others and therefore more exams are possible. In addition, some students who do take an AP course may choose not to take the associated exam.
There are wide differences in participation rates among our public high schools. In Table 2 they are ranked by increasing rates.[4]
Table 2

Successful Results in AP Exams
The College Board does not publish the number of exams with scores at each level, 1-5, for each high school. It only publishes the aggregate of scores 3, 4, and 5. For this analysis, that is what we consider “successful.” As shown in Table 1, among all AP exams taken over the four years 2018 to 2021, 69.1% resulted in a successful score. As with participation, there is great variation in successful scores among the NH public high schools as shown in Table 3.
Table 3

Some care must be used in interpreting these percentages. The denominator is the count of exams taken. Some schools or teachers encourage all students who have taken an AP course to take its associated exam. Others, however, may counsel some students they fear will not do well not to take the exam. Counseling students who may not do well outside of taking the exam increases the percentage that will do well. There is no way to determine how many differences among schools shown in Table 3 may be due to this difference in approach.
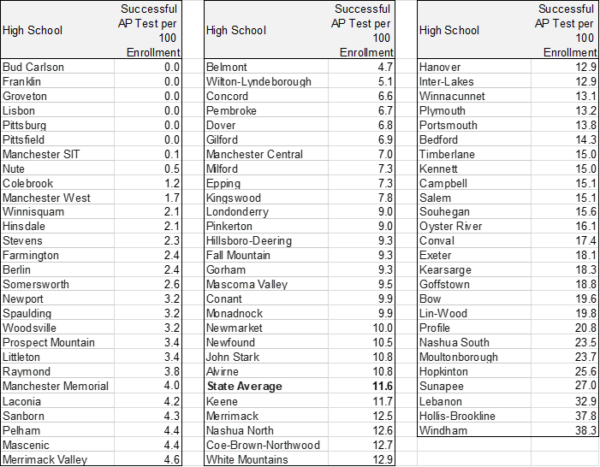
A better measure is the number of successful exams per 100 enrollments in each high school. This measure combines two factors: the propensity of students to take AP courses and the propensity of those who do so ultimately to have a successful score on the exams. The state average in the 2018-21 period was 11.6 successful exams per 100 students. As with the other measures, there is a wide variation among schools as shown in Table 4.
Table 4
Relation to Income of Students’ Families
High schools with higher percentages of students from lower-income families tend to have a smaller percentage of students taking AP exams. The relationship is depicted in Figure 1.
Figure 1

The number of students who applied for and received free or reduced-price meals in 2020 is a proxy measure for the economic status of the households of a school’s students. It is by no means a perfect measure but is the one that is available and is used for various policy purposes.
The horizontal axis of Figure 1 is the percentage of students in each high school who were receiving free or reduced-price meals in 2020[5]. The downward-sloping line shows the trend in the data.[6] Schools with a lower percentage of low-income students clearly have greater participation in AP courses and exams. Some schools that are far off the trend line or are extreme in participation are named.
While the general trend is clear, so too are large differences between schools with similar percentages of low-income students. For example, about 3% of the students at both Hollis-Brookline and Pelham are low-income. Nevertheless, there were only 4.4 successful AP exams per 100 students at Pelham, while at Hollis-Brookline there were 37.8, an 8-fold difference.
Relation to School Size
For this analysis, we have used average enrollment over the four years from 2018-2021. Schools with less than 350 students are “small”, those with 351-750 are “medium” sized, and those with 751 or more are “large.”
Table 5

Larger schools are often able to offer a wider range of courses and therefore more likely to include AP courses among those available to their students. Table 5 shows that the proportion of successful AP exams is higher for larger schools.
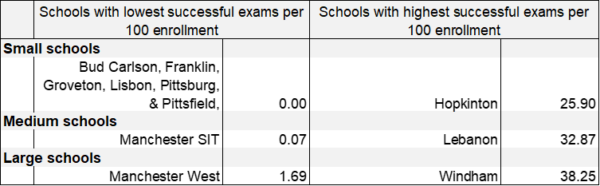
There is, however, considerable difference among schools in each of the three size categories. Table 6 displays the schools with the lowest and highest successful AP exam rate in each of the three size categories.
Table 6
Relation to Property Value per Pupil
Equalized property value per pupil (EQVP) is the amount of tax base a community has to support the education of each of its students. Communities with lower EQVP require higher tax rates to raise the same amount of funds per pupil as property wealthier ones. In the 2020-21 year, the average EQVP in New Hampshire was $1,346,793.[7]
We have divided high schools into four categories based on their 2020-21 EQVP. For high schools with the lowest tax bases – less than $850,000 EQVP – the participation in AP exams and the relative level of success in those exams is considerably below that of the other three groupings. The 20 schools in the fourth category all have EQVP above the state average.
Table 7

The fifteen high schools in the category with the lowest EQVP are Berlin, Bud Carlson, Colebrook, Farmington, Franklin, Groveton, Hinsdale, Lisbon, Mascenic, Newport, Pembroke, Pittsfield, Spaulding, Stevens, and Woodsville.
AP Course Availability and Testing
Each high school provides students with a course catalog from which they select the courses they desire to take the following year. These catalogs include the name and description of each of the AP courses it plans to offer. We collected the catalogs for the 2021-22 school year and counted the number of AP courses listed.
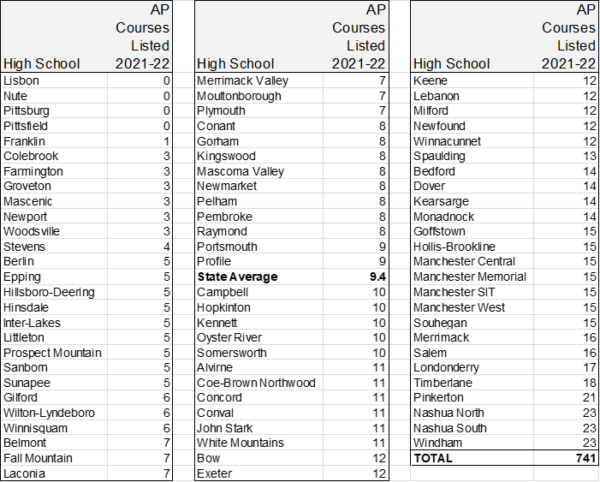
79 high schools listed 741 AP courses in their catalogs.[8] Lisbon, Nute, Pittsburg, and Pittsfield were the only high schools that did not list a single AP course in their catalogs. Nashua North, Nashua South, and Windham each listed 23 AP courses, the most of any school. The average was 9.4 AP courses per high school.
Offering an AP course is not the same as conducting the course during the year. Sometimes too few students sign up for a course and it therefore never takes place. In other cases, the trained AP teacher may leave the school before the year begins. While the NH Department of Education does publish the College Board’s reports on AP test-taking and results each year, it evidently does not collect information on the courses offered or those conducted at each high school.
Table 8 displays the number of AP courses listed in each high school’s 2021-22 course of studies.
Table 8
Conclusion
Advanced Placement courses offer students an opportunity to take their knowledge to the next level while also earning credit for their future academic careers. Unfortunately, as seen from this report, not all public school students in New Hampshire have equal access to AP courses and exams. Students who attend smaller schools or reside in communities with lower-than-average property values are at a disadvantage when it comes to AP courses and exams. Not only are these students underperforming compared to their counterparts, but many also do not have access to AP classes at all.
[1] https://apstudents.collegeboard.org/about-ap-scores/ap-score-scale-table
[2] https://apstudents.collegeboard.org/getting-credit-placement/search-policies/course/5
[3] The College Board State and District Integrated Report for each year is on the NH Department of Education website: https://www.education.nh.gov/who-we-are/division-of-educator-and-analytic-resources/bureau-of-education-statistics/non-statewide-assessment-college-board-reports
[4] In all references to individual schools we do not include “High School,” “Academy,” or other terms and use just the common name.
[5] https://www.education.nh.gov/sites/g/files/ehbemt326/files/inline-documents/sonh/lunch-school20-21.pdf
[6] R squared is 0.303
[7] https://www.education.nh.gov/sites/g/files/ehbemt326/files/inline-documents/sonh/EVPP-FY-2021-PDF_0.pdf
[8] Bud Carlson, Hanover, and Lin-Wood never provided course catalogs from which a count could be made.