We talk a lot about the disparate impacts of our school funding system on different communities, and how the impact of the State downshifting over $2 Billion in education costs every year is not spread evenly around the State.
How we can compare places of different sizes with different student populations is with Equalized Property Value per Pupil (EQVP), which is calculated by adding up the total taxable value of all the property in a town, and dividing it by the number of students who live there. As a general rule, communities with high EQVP have lower property tax rates than communities with low EQVP. For example, Town A with $2 million in EQVP could have half the tax rate of Town B with $1 million in EQVP and be able to raise the same amount of money.
And as you’ll see in the chart below, that general rule applies across New Hampshire. As EQVP goes up, education property tax rates go down. Use the search bar to see where your town is.
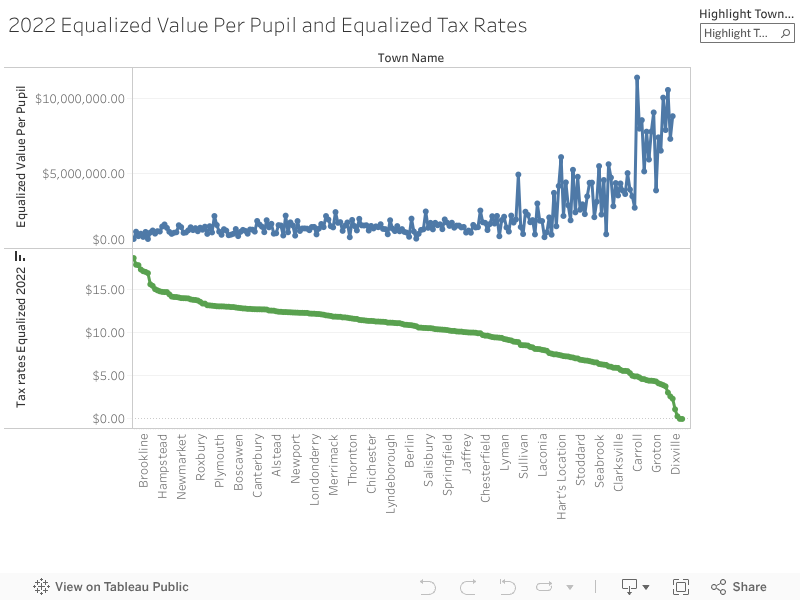
We removed Millsfield ($31,742,329 EQVP), New Castle ($19,801,104 EQVP), and Newington ($16,114,257 EQVP) from the chart above because their EQVP was so much higher than the other cities and towns that it made the chart hard to read.