
School Funding and Special Education: It Continues to Get Worse
By Carly Prescott, MPP, February 2025
One of the primary purposes of public education is to “promote student achievement and preparation for global competitiveness by fostering educational excellence and ensuring equal access.”[1] This means that all students—regardless of race, gender, ethnicity, or disability—should have equitable educational opportunities. To meet the diverse needs of students across the state Individualized Education Programs (IEPs) are implemented to ensure that students receive the specialized support they require in school.
Beyond the core services offered in public schools, students with disabilities and IEPs need additional resources and instruction. While these resources are essential, they are also expensive. Due to inadequate state funding, the financial responsibility for these critical services largely falls on local property tax payers.
In New Hampshire, during the 2023-2024 school year, 31,469 (ADM-R)[2] students—20% of the student population—received special education services. With one in five students relying on these services, and limited state support, many schools and towns struggle to meet complex funding demands. Although special education funding is included in the state’s adequate education formula, only 16.65% of the actual costs of these services are covered by state and federal funds. As a result, much like other public education costs, the majority of special education expenses are shifted onto local property tax payers.
This report examines how New Hampshire’s inequitable funding structure affects both students with disabilities and the communities that support them.
Key Findings:
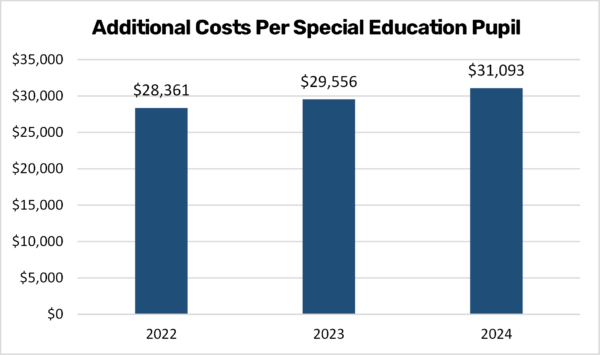
- The average additional cost to educate one student with an IEP in New Hampshire was $31,093 in 2024, up 5.2% from 2023.
- The average cost to educate one student without an IEP in New Hampshire in 2024 was $18,719, a 1.6% increase from 2023.
- State and Federal Governments paid 16.65% of costs associated with Individualized Education Programs (IEPs) in 2024.
- In 2024, 70 (or 40%) of New Hampshire public school districts spent over 25% of their total expenditure on IEP expenses, up 10 districts from 2023.
- Brentwood School District spent 46.7% of its total expenditure on IEP expenses in 2024, the highest proportion in the State.
- The State contributed, on average, $3,285 additional per student with an IEP, which was only 10.57% of the actual additional cost.
- Special Education Aid (formerly called Catastrophic Aid) provided only 3.68% of the total funding for disability services within New Hampshire’s public schools in 2024.
How is Special Education Funded?
New Hampshire taxpayers contributed nearly $3.88 billion to public education in the 2023-24 school year. Of that amount, $978 million—25.23%—was allocated to disability services, reflecting a 6.91% increase from the previous year. Notably, the costs of special education are rising at more than three times the rate of general education expenses. As with other public school services in the state, funding for students with disabilities relies heavily on local property taxes.
According to data published by the Department of Revenue Administration (DRA) and Department of Education (DoE), on average, 70% of all revenues funding New Hampshire’s public schools come from local property taxes (including the Statewide Education Property Tax (SWEPT)). The other 30% of revenues come from the State and the Federal Governments. In 2024, local property taxes funded 83.35% of special education revenues, while state and federal governments contributed 16.65%.
The formula used by the State to determine the grants to schools and communities is based on the Average Daily Membership in Residence (ADM-R) of each community. The State contributed a base grant of $4,100 for every public school student. The State added $2,300 for students eligible for free and reduced-priced meals (FRL), an additional $2,100 for students with IEPs, and an additional $800 for students who were English language learners. The rest of the costs were paid for by other state grants, federal monies, and local property tax bills.
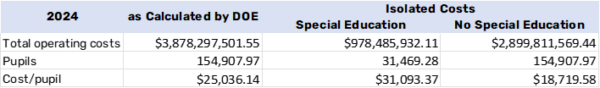
The average cost per student during the 2023-24 school year, including transportation, was $25,036. Excluding IEP costs, this average dropped to $18,719. In Table 1, the costs of education per pupil are displayed. The DoE adequacy grant calculation spreadsheet for 2023-24 noted that 31,469 students received disability services (ADM-R). On average, the cost per pupil for these students was $49,812. This is $31,093 more per student than students without IEPs . It is important to note that this number hides a huge range. Some students with disabilities require only a few hundred dollars of additional services while others require out-of-district placements that usually cost more than $100,000 per year.
Table 1
Breaking Down the Costs
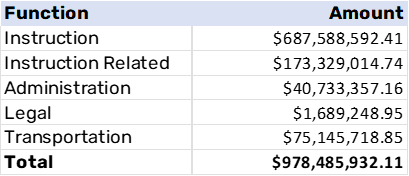
The DoE annually prepares and publishes a file of revenues and distribution of expenditures for all school districts combined.[3] For 2023-24, the DoE report stated that total special education costs were $978,485,932.11. Table 2 displays the breakdown of total special education costs.
Table 2
How do we pay for it?
Federal regulations like the Individuals with Disabilities Education Act (IDEA) ensure a free and appropriate public education for all children with disabilities. New Hampshire school districts receive aid from the Federal government and the State government to support their IEP programs. The table below displays the monies received by school districts from these sources.
Every year, the DoE collects a DOE-25 spreadsheet from each district. The DOE-25 shows the total received from government sources for 2023-24.
Table 3
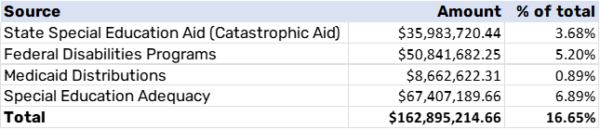
On average, the State paid $3,285 per student with an IEP, just 10% of the total average cost. The federal and state governments together paid only 16.65% of the total costs of these services, which are all a result of federal or state-mandates. Local property taxpayers picked up the remaining 83.35% of the costs associated with IEPs, totaling $815,590,717, $60 million more than the previous year.
Distribution Among Districts
These costs, however, are not evenly distributed among the districts and towns of the state. More than half of New Hampshire’s municipalities have below-average property tax bases, meaning that the total value of taxable property per pupil in these communities is lower than the state average. A lower property tax base limits a municipality’s ability to generate sufficient revenue through property taxes, making it more challenging for these communities to fund public services, including special education. Additionally, individual IEP costs are volatile and difficult to predict, further complicating budgeting for towns with tighter financial resources. For these communities, adjusting for the unpredictable costs of special education can be especially challenging.
Additionally, “State Special Education Aid”, previously known as Catastrophic Aid, is reimbursed to schools for each student that costs 3.5 times the state average of $21,534 ($75,369), or more. Local school districts must meet these students’ immediate needs with no additional help from the state until the following year when the reimbursement is paid. However, State Special Education Aid accounts for only 3.68% of funding for IEP services. The $35,938,720, outlined in Table 3, has remained stagnant and only increased $2 million in 2023-24 when the state increased the age requirements for public schools to serve children with disabilities until age 21 inclusive.[4] As aforementioned, this does not meet the needs of all students whose services cost more than $75,369 each year.
Trends Over Time
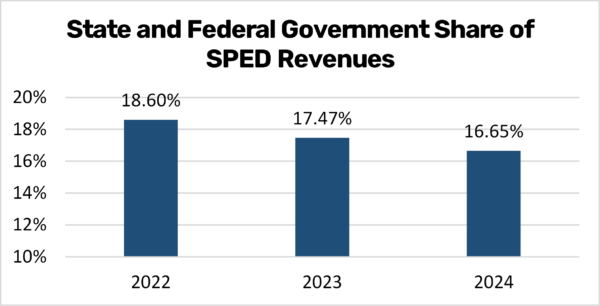
Figure 1 shows that over the past three years, the State and Federal government’s share of special education funding has steadily decreased, falling from 18.6% in 2022 to 16.65% in 2024. This decline shows a greater share of the financial responsibility shifting to local property tax payers, who must cover the rising costs of providing special education services.
Figure 1
Despite federal mandates requiring schools to meet the needs of students with disabilities, funding from higher levels of government has not kept pace with growing expenses. As a result, local taxpayers bear an increasing burden, forcing difficult budget decisions that can impact the quality and availability of services for students who rely on them.
Figure 2

While the state and federal share of special education funding has declined, total special education expenditures have continued to rise. Figures 2 and 3 show that in 2022, New Hampshire’s Public Schools spent approximately $842.7 million on special education services, a figure that grew to $915.2 million in 2023 and reached $978.5 million in 2024.
Figure 3
This increase reflects the rising costs of providing necessary support to students with disabilities, including specialized instruction, staffing, and services. With state and federal contributions covering a shrinking portion of these expenses, local communities are left to fill the gap, placing additional strain on already limited resources.
Who Spent the Most?
Every community in New Hampshire has students with disabilities. Each year, the number of students with disabilities fluctuates when students move into or out of the school district, or when their service needs change. All these factors influence the total cost of disability services.
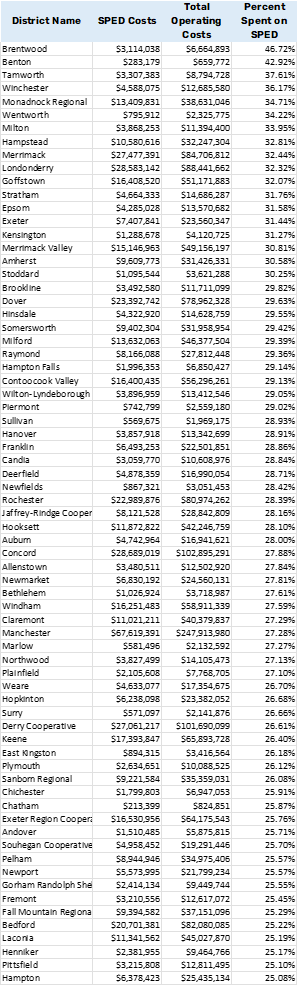
In 2024, 70 of the 172 (40%) public school districts in New Hampshire had special education expenditures that exceeded 25% of their total budget. Table 4 lists those 70 districts.
Small schools, regional schools, cooperative schools, and larger city schools are represented in this list. No matter the size, region, or enrollment, costs associated with disability services can be a large percentage of overall spending in a school district.
Brentwood School District, which operates an elementary school and then sends students to Exeter Cooperative, saw a very large jump in their special education costs, pushing them to the highest percentage spent in the state.
Which Districts Saw the Biggest Jump Between 2023 and 2024?
Of the 172 school districts in New Hampshire, 123 (71%) saw an increase in their special education expenditures. In Table 5, the 10 districts with the highest percentage increases are displayed. As seen, some of the smallest districts see the most extreme volatility year to year.
Table 5
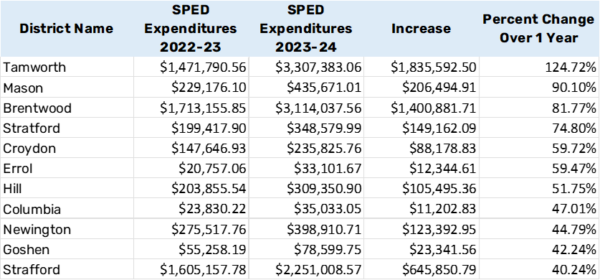
Tamworth School District’s special education expenditure increased by 124% in the past academic year. School districts, school boards, and other administrative staff cannot budget for such dramatic increases.
Conclusions
Students with disabilities have a federal and state protected right to a free and appropriate public education. These students deserve to be seen as more than just a financial burden to their local communities. While the cost to educate students with disabilities can vary widely, so can the ability of communities to pay for such services. Special education funding is both costly and unpredictable; downshifting these expenses to local communities creates deep inequities for students and taxpayers alike.
With State and Federal governments covering less than 17% of special education costs, local school districts and towns must provide and pay for those resources. New Hampshire’s communities have vastly different abilities to raise revenue for their schools and students. The state’s downshifting of financial responsibility to the local property tax payer puts a strain on individual communities and creates inequitable funding models.
This report shows that the costs to educate students with disabilities are increasingly downshifted annually to local property taxpayers while the responsibility of the State continues to decrease.
Equitable public education funding in New Hampshire could provide more stability for districts and equal opportunity for our students with disabilities. The different costs associated with providing each student with federally mandated disability services are volatile and ever-changing. Exploring ways of shifting the $815+ million in special education expenditures currently shouldered by local property tax payers back to the State could ensure all students with disabilities are equitably provided for.
[1] U.S Department of Education
[2] Average Daily Membership In Residence
[3] The 2023-2024 report indicates that “Special Programs” cost $745,258,638, 19.7% of all expenditures. This does not mean that 19.7% of all school district costs are for special education. “Special Programs” contains some expenses that are not related to special education. As the DoE accounting handbook states, “Special Education Programs are for students with disabilities, Special Programs is a broader category which also includes non-special education programs.” Those include costs for “culturally deprived”, bilingual, and gifted and talented programs of schools that might have them. Also importantly, “Special Programs” does not include other important extra costs associated with students who have IEPs. The accounting handbook also states that it does “not include expenditures for psychological services, speech and audiology, occupational therapy, and transportation services. These are reported as student support services and transportation services.”
[4] Students were previously served until they turned 21.