
The University of New Hampshire (UNH) is the largest public university in New Hampshire. UNH offers a plethora of post-secondary degrees including Business, STEM, liberal arts, and agriculture. From 2017 to 2021, 18,455 students from New Hampshire’s public schools applied to UNH.
UNH is the most expensive of all New Hampshire’s state schools, with in-state tuition at $15,520 in 2021, not including room and board. The average cost for in-state public university tuition in the country is $7,460.
The following analysis seeks to understand the differences between New Hampshire’s public schools by examining students’ rates of application, admittance, and enrollment to the University of New Hampshire.
For this study, the University of New Hampshire has provided the NH School Funding Fairness Project (NHSFFP) with counts of student applications, admissions, and enrollments from New Hampshire public school students from 2017 to 2021. Trends were also compared to a similar report published in 2001.
Key Findings:
- New Hampshire’s public high schools had an average application rate of 27.1%, an average admission rate of 83.87%, and an average enrollment rate to UNH of 7.47%.
- The 10 schools with the lowest Equalized Value Per Pupil (EVPP) had lower rates of application, admittance, and enrollment than the schools with high EVPP.
- The 10 schools with the highest percentages of students eligible for Free and Reduced-Price Lunch (FRL) had lower rates of application, admittance, and enrollment than schools with low percentages.
- The percentage of students FRL-eligible had a greater impact on enrollment to UNH than the EVPP of the school.
- High schools near the UNH campus in Durham had higher rates of applications and enrollment.
- On average, the percentage of applicants that were accepted to UNH has not changed over the past 20 years.
Definitions
This paper looked at three measures:
Application rate: This is the percentage of students enrolled in their senior year in high school who apply to UNH for admission for the following year. Students living near UNH are more likely to apply, potentially because they are familiar with the campus and may be able to live at home.
Acceptance of Applicants rate: This is the percentage of students who have applied to UNH that are accepted. The admissions staff evaluates grades, recommendation letters, extracurricular activities, essays, test scores, and other factors when deciding whether to admit applicants. UNH accepts many times more applications than they expect to result in enrollment. This is based on experience and the fact that most applicants have also applied to many other colleges.
Enrollment rate: This is the percentage of students in their senior year in high school who enroll at UNH for the following year.
Each of these percentages may vary considerably from year to year for small high schools. We used sums over five years to smooth out those variations.
Applications
Students in New Hampshire are not required to apply to UNH or any post-secondary education. The rate of applications to UNH from each public high school can be used to show students’ potential interest in attending UNH. It does not say much about the performance of the students applying. Nonetheless, comparing different rates of applications to UNH from NH public high schools can demonstrate student interest in pursuing educational opportunities post-grad.
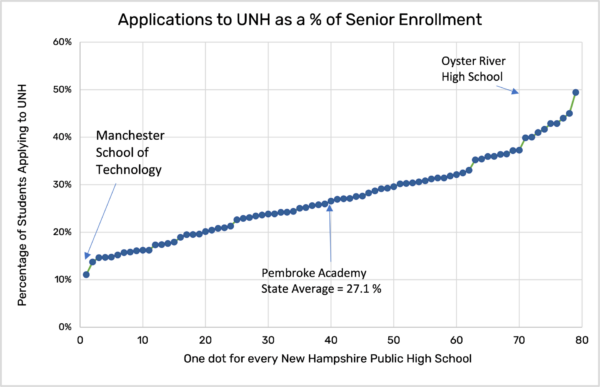
Overall, application rates from NH public high schools to UNH range from 11.1% to 49.4%. The school with the lowest percentage of applications to UNH was Manchester School of Technology and the school with the highest percentage of applications was Oyster River (which shares a town with UNH).
Figure 1 displays all NH public high schools in order of lowest to the highest percentage of seniors applying to UNH. Pembroke Academy, which had 27.1% of its seniors apply to UNH, fell on the state average.
Figure 1
Admissions
While the percentage of applications demonstrates a potential interest in going to UNH, not all students are admitted. Measuring admissions to UNH as a percentage of the applications submitted can offer us a glimpse into the performance of each school’s college-bound students.
Figure 2 displays all NH public high schools in order of percentage of applicants that were admitted to UNH from lowest to highest. Wilton-Lyndeboro Senior High School had the state average, with 83.87% of its applicants admitted to UNH.
The schools with the lowest acceptance rate were Groveton High School and Raymond High School. During 2017-2021, only 31 seniors at Groveton applied to UNH, and only 15 were admitted. As seen on the graph, Groveton’s admission rate was far below the rest of the state. The reasons for this are unknown. The schools with the highest acceptance percentage were Lisbon and Hinsdale. Lisbon in particular was the only school to which every student who applied was admitted. They had 37 seniors apply to UNH and 37 students were admitted during the five years of data analyzed.
Figure 2

Enrollments
Unlike admission rates, the rate of enrollment to UNH demonstrates a commitment to attending UNH, rather than a potential performance measure. .
For example, of the 1,831 seniors at Nashua North between 2017-2021, 125 or 14% of them enrolled at UNH.
In Figure 3, each public high school is represented in order from lowest enrollment rate to highest enrollment rate. The rates ranged from 2.7% to 16.75% of the total senior classes over the 5 years.
Figure 3

Hanover High School was an interesting outlier in this analysis. While most of the students who applied to UNH from Hanover were admitted, very few of them enrolled. Hanover is one of the wealthiest schools in the state, with an EVPP of $2,578,085 (double the state average in 2021) and only 4.94% of students are eligible for free and reduced lunches.
Furthermore, Hanover has a graduation rate of 96.4% and an average SAT score of 1283 (the highest average score in the state) from the years 2018-2020. Because of the high performance of the students and the wealth held in the area, the low enrollment to UNH may be because students enrolled elsewhere, particularly out of state.
A factor that appeared to increase enrollment rates, on the other hand, was geographic proximity to the UNH campus. Dover and Oyster River High Schools had some of the highest enrollment rates and are within 10 miles of UNH.
UNH Applications, Admissions, and Enrollments Compared to Financial Measures
Measures of a school’s financial capacity and the socioeconomic standing of the students are often used as indicators of need. The percentage of students who are eligible for Free and Reduced-Priced Lunch (FRL) is often used to measure the concentration of low-income students (or students navigating poverty) in each school district. To qualify, a family must earn below 185% of the Federal Poverty Line. The rates range from 1.52% in Windham to 43.3% in Groveton. In the 2020-2021 school year, 16% of New Hampshire students were eligible on average.
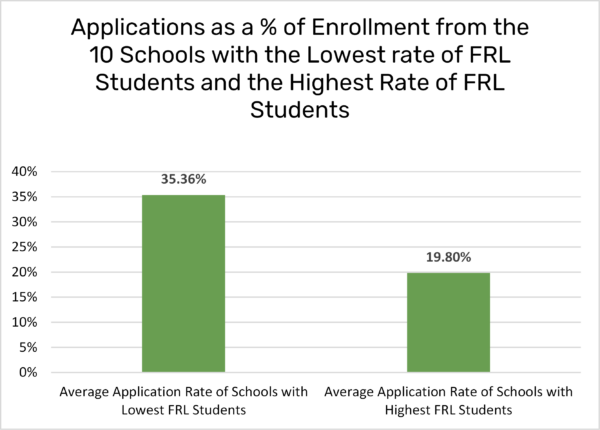
In Figure 4 (to the left), the average application rate of the 10 schools with the lowest percentage of FRL-eligible students was compared to those of the 10 schools with the highest percentages. As seen on the graph, those with the smallest percentage of students navigating poverty had considerably higher instances of students applying to UNH.
The 10 high schools with the lowest percentages of FRL-eligible students were as follows: Windham (1.5%), Hopkinton (1.5%), Bow (2.5%), Pelham (2.7%), Coe-Brown Northwood (2.8%), Hollis Brookline (3%), Sanborn (3%), Bedford (3.8%), Merrimack (4.5%), and Hanover (5%).
The 10 high schools with the highest percentages of FRL-Eligible students were as follows: Manchester School of Technology (35%), Berlin (35%), Newport (36%), Manchester Central (37.5%), White Mountains (39%), Franklin (40%), Littleton (41%), Laconia (41%), Manchester West (42%) and Groveton (43%).
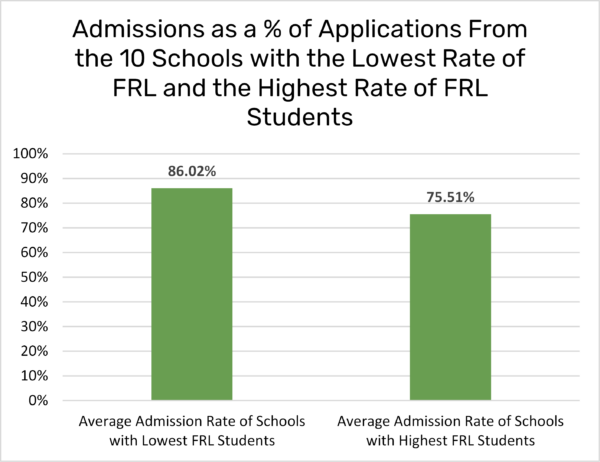
Figure 5 (below to the left) shows similar results in the admissions data. Fewer students eligible for FRL yielded higher admission rates.
For enrollment, in Figure 6 (below to the right), the trend held. On average, higher rates of students who applied were accepted, and enrolled from high schools with lower rates of students eligible for FRL.

Equalized Value Per Pupil (EVPP) is the total amount of taxable property value available in each town to fund a student’s education. The state average EVPP in 2021 was $1,346,793. Because many high schools in New Hampshire cover multiple towns and municipalities, the EVPP for a given district is the aggregated EVPP of all the towns in the district. For example, at Kearsarge Regional High School, students are from Sutton, New London, Springfield, Warner, Newbury, Bradford, and Wilmot. All these towns combined, on average, had an EVPP of $2.29 million in 2021.
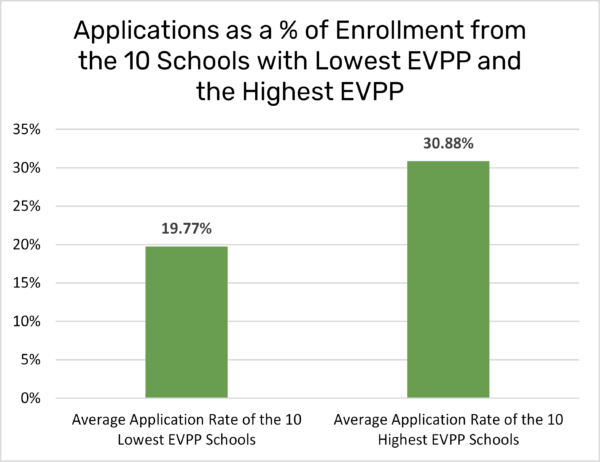
There were similar trends comparing schools with the lowest and highest average EVPPs. As seen in Figure 7 (below to the left), the schools with the lowest EVPP in the state had an 11.11% lower application rate than the schools with the highest EVPP. This was less than the 15.56% difference between schools when FRL was used as a measure.
For admissions to UNH, in Figure 8 (below to the right), the gap between the highest property wealth and the lowest shrank, with 3.49% between the two measures.

When it comes to enrollments at UNH and EVPP, there were similar patterns, as seen in Figure 9 (below). While the difference between these two measures was under 2%, it demonstrated that FRL may play a bigger role than EVPP in enrollment at UNH. Both low EVPP schools and high EVPP towns averaged below the overall state enrollment average. Furthermore, Portsmouth High School and Winnacunnet High School both have high EVPP but are also near UNH.
 The high schools with the lowest EVPP in 2021 were as follows: Stevens ($523,285), Berlin ($539,253), Groveton ($552,013), Pittsfield ($615,452), Newport ($649,873), Woodsville ($715,354), Hinsdale ($755,573), Lisbon ($793,847), Spaulding ($795,161), Franklin ($805,637) and Mascenic ($807,225). The high schools with the highest EVPP in 2021 were as follows: Profile ($2,187,563), Kearsarge ($2,290,026), Gilford ($2,408,097), Hanover ($2,578,085), Winnacunnet ($2,860,080), Kingswood ($2,901,363), Portsmouth ($3,399,350), Inter-Lakes ($3,897,909), Sunapee ($4,128,142), Lin-Wood ($5,137,916) and Moultonborough ($8,987,902).
While the rates of enrollment to UNH are below that of overall post-secondary enrollment, these trends could be similar. In Figure 10, the enrollment rates at UNH are compared to the overall post-secondary enrollment rate from 2020 . As seen, there is a positive correlation between the two measures. While not perfectly linear and with several outliers, it does infer that there is a relationship between the measure of UNH enrollments to other post-secondary options.
Figure 10

1999-2001 Comparisons
In 2001, the University of New Hampshire collected similar data on applications, admissions, and enrollments. Unlike the data used in this report, only three years of data were provided by the University.[2]
In the data, the average admission rate to UNH was 84%. In this report, that percentage was 83.9% and remained consistent over time.
This data also showed a change in public high schools over time. Most notably, Nute High School had the lowest percentage of applicants who were accepted between 1999-2001. Based on the data from 2017-2021, Nute High School had one of the highest acceptance rates in the state: 89.7%. On the other end, the percentage of applicants admitted to UNH from Groveton dropped from 74% to 48% in the same period.
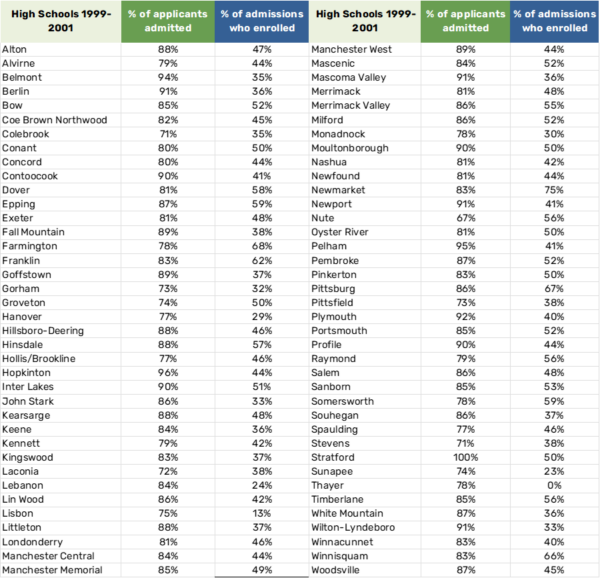
In Table 1 the percentage of applicants admitted to UNH between 1999 and 2001 are listed in alphabetical order.[3]
Table 1
Conclusion
Post-secondary enrollment is not the only measure of success in a public high school. While the University of New Hampshire is the state’s largest state university, it is not the only option for students. Many students go to universities and colleges in other states, learn the trades, join the military, or do something else entirely.
This data showed that the application rates, admission rates, and enrollment rates to UNH vary greatly among NH’s public high schools. Furthermore, this analysis demonstrated how certain financial capabilities and the socioeconomic standing of students in a high school can have an impact on applications, admissions, and enrollment at UNH. The difference between rates of applications, admissions, and enrollment among schools with lower or higher proportions of students eligible for FRL outweighed those with low and high EVPP. For those enrolling at UNH from schools with lower average EVPP, the gap between measures was only 1.8%, while for FRL measures, the gap was 4.15%.
According to the findings of this analysis, the percentage of students eligible for free and reduced-price lunch and a school district’s average Equalized Value Per Pupil both have impacts on their application, admission, and enrollment rates at UNH. Additionally, as shown by the connection between UNH enrollment and other post-secondary options from 2020 (Figure 10), these measures of financial capacity at the individual and community level could also serve as indicators of the ability of students to attend other post-secondary institutions.
Download a Copy of this Analysis
[1] There are several high schools within a 20-mile range of UNH’s Durham Campus. They are Oyster River, Dover, Portsmouth, Newmarket, Exeter, Somersworth, Coe-Brown Northwood, Spaulding, and Winnacunnet.
[2] Provided to New Hampshire Center for Public Policy Studies.
[3] Note that there are changes in school names and some schools have dissolved or been added over time.