
University Of New Hampshire Applications, Admissions, and Enrollments from New Hampshire Public High Schools
April 2025
Carly Prescott, MPP
Introduction
The University of New Hampshire (UNH) is the largest public university in New Hampshire. UNH offers many post-secondary degrees, including Business, STEM, liberal arts, and agriculture. Between 2017 and 2024, 27,263 students from New Hampshire’s public schools applied to the University of New Hampshire (UNH).
By examining the rates of application, admission, and enrollment from New Hampshire public high schools, we can learn a bit about the population of college-bound students. The following analysis aims to understand the differences between New Hampshire’s public schools by examining students’ rates of application, admission, and enrollment at the University of New Hampshire.
For this study, the University of New Hampshire has provided the NH School Funding Fairness Project (NHSFFP) with counts of student applications, admissions, and enrollments from New Hampshire public school students from 2017 to 2024.
Key Findings:
- New Hampshire’s public high schools had an average UNH application rate of 27.64%, an average admission rate of 84.19%, and an average enrollment rate of 7.12%.
- Increased poverty (as measured by enrollment in the Free and Reduced Price Lunch Program) strongly correlates with lower UNH application rates.
- Even when admitted, students from schools with a higher FRL Eligibility are less likely to enroll at UNH.
- Admissions to UNH hold steady across different high schools, more so than applications or enrollment
- Students from schools with less FRL Eligibility apply, are accepted, and enroll at higher rates.
- Proximity to UNH increases the likelihood of application and enrollment.
Definitions
This paper looks at three measures:
- Application rate: This is the percentage of students enrolled in their senior year in high school who apply to UNH for admission for the following year.
- Acceptance of Applicants rate: This is the percentage of students who have applied to UNH and are accepted. The admissions staff evaluate grades, recommendation letters, extracurricular activities, essays, test scores, and other factors when deciding whether to admit applicants. UNH accepts many times more applications than it expects to enroll, as most applicants have also applied to many other colleges.
- Enrollment rate: This is the percentage of students in their senior year in high school who enroll at UNH for the following year.
Each of these percentages may vary considerably from year to year for small high schools. When comparing schools, we used the sums over the eight years studied to smooth out those variations.
Applications
New Hampshire public high school students are not required to apply to UNH or any post-secondary institution. Comparing different rates of applications to UNH from NH’s public high schools can demonstrate student interest in pursuing educational opportunities after high school graduation.
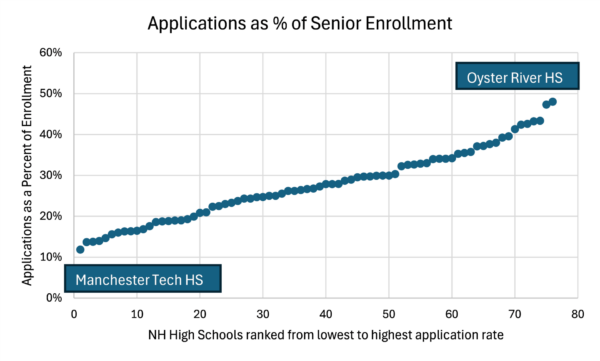
Overall, application rates from NH public high schools to UNH range from 11.86% to 48.03%. The school with the lowest percentage of applications was Manchester School of Technology, and the school with the highest was Oyster River (also located in Durham, NH). Several schools within 10 miles of UNH had higher-than-average application rates. Those schools are Portsmouth (47%), Exeter (42%), Newmarket (37%), Dover (35%), and Winnacunnet (37%).
Figure 1 displays all New Hampshire public high schools in order from the lowest to the highest percentage of seniors applying to UNH (you can find the complete list of application rates for each school in the table at the end of this paper). Pembroke Academy, which had 27.64% of its seniors apply to UNH, fell just below the state average. Students living near UNH are more likely to apply, potentially because they are familiar with the campus and may be able to live at home.
Figure 1
Admissions
While the percentage of applications demonstrates a potential interest in going to UNH, not all students are admitted. Measuring admissions to UNH as a percentage of the applications submitted can offer us a glimpse into the performance of each school’s college-bound students.
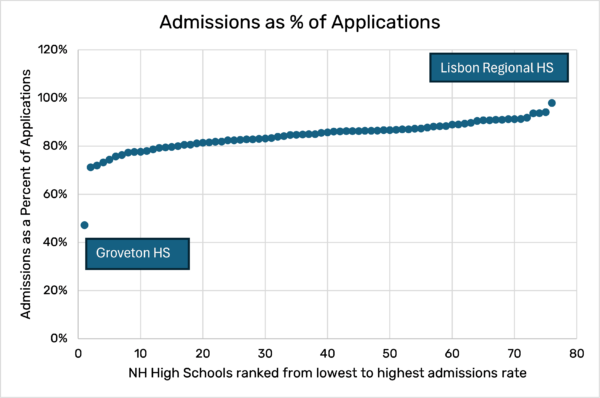
Figure 2 displays all New Hampshire public high schools in order from the lowest to the highest percentage of applicants who were admitted to UNH (you can find the complete list of admissions rates for each school in Table 1 at the end of this paper). Concord High School had the state average, with 84.19% of its applicants admitted to UNH.
The schools with the lowest acceptance rate were Groveton High School (47%) and Pittsfield High School (71%). During 2017-2024 (8 academic years), only 53 seniors at Groveton applied to UNH, and only 25 were admitted. As seen on the graph, Groveton’s admission rate was far below the rest of the state. According to the Groveton Guidance Department, a majority of the students chose to attend the local community college option. The schools with the highest acceptance percentage were Lisbon (97%) and Hinsdale (94%).
Figure 2
Enrollments
Unlike admission rates, the rate of enrollment at UNH demonstrates a commitment to attending UNH, rather than a potential performance measure. 7.12% of all NH public high school seniors from 2017-2024 enrolled at UNH.
For example, of the 3,094 seniors in Concord between 2017-2024, 242 or 7.8% of them enrolled at UNH.
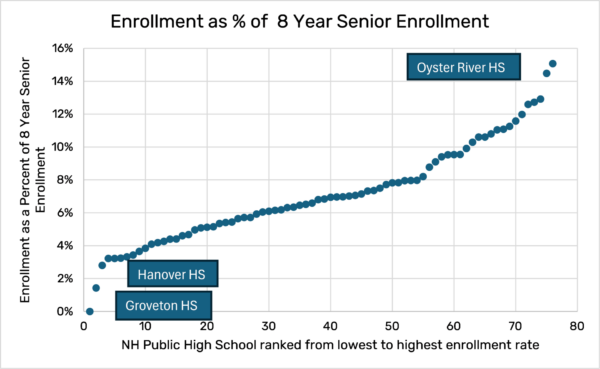
In Figure 3, each public high school is represented in order from lowest enrollment rate to highest enrollment rate. The rates ranged from 0% to 15.07% of the total senior classes over the 8 years.
Hanover High School was an interesting outlier in this analysis. While most students from Hanover who applied to UNH were admitted, only 3.22% ultimately enrolled. Hanover is one of the wealthiest school districts in the state, as reflected in its Equalized Value Per Pupil (EVPP) — a measure of the community’s property wealth divided by the number of students it serves. Hanover’s EVPP is $3,693,136, nearly double the state average in 2024. This high level of local property wealth, combined with the fact that only 5.49% of its students are eligible for free and reduced-price lunch (compared to the statewide average of 20%), points to a community with significant financial resources.
Furthermore, Hanover has a graduation rate of 96.4% and had an average SAT score of 1283 (the highest in the state) from the years 2018-2020. Because of the high performance of the students and the wealth held in the area, the low enrollment at UNH may be because students enrolled elsewhere, particularly at closer universities like UVM in Vermont, Dartmouth, Plymouth State University, or out of state.
A factor that appeared to increase enrollment rates was geographic proximity to the UNH campus in Durham. Dover, Exeter, Newmarket, Oyster River, and Portsmouth High Schools had the highest enrollment rates and are within 10 miles of the main campus.
Figure 3
Free and Reduced Priced Lunch’s Impact on UNH Applications, Admissions, and Enrollments,
Free and reduced-price lunch (FRL) eligibility is widely used as a proxy measure for student poverty, as there is limited income data in NH. While not a perfect indicator, FRL status offers a practical way to assess economic disadvantages at the school and district level. Many state school funding formulas—including New Hampshire’s—use FRL data to allocate additional resources to districts serving higher numbers of low-income students. The goal is to promote greater equity by recognizing that students facing economic hardship often require more support to achieve academic success.
Figure 4
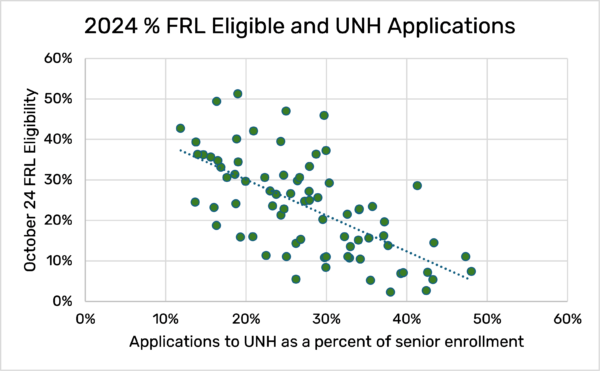
Overall, as Figure 4 demonstrates, there is a clear pattern: high schools with higher FRL eligibility tend to have lower rates of students applying to UNH. Over the eight years from 2017-2024, application rates from high-eligibility schools have consistently lagged those from low-eligibility schools. The reasons for this gap are complex, likely reflecting a range of factors, including limited access to college counseling, financial concerns, and fewer academic or extracurricular opportunities that strengthen college applications. This trend underscores the broader challenges faced by students in high FRL eligibility communities when navigating the path to higher education.
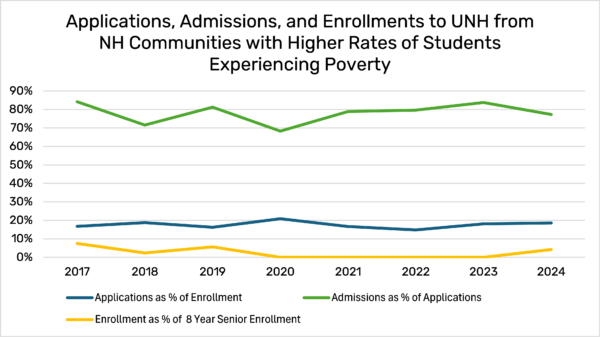
Figure 5 illustrates trends in UNH applications, admissions, and enrollments in the 6 high schools with the highest FRL Eligibility between 2017 and 2024. Manchester West High School, Littleton High School, Berlin High School, Pittsfield High School, Newport High School, and Franklin High School are among the schools with FRL eligibility reaching over 34%.
While application rates have fluctuated, there was a noticeable spike in 2020, at the beginning of the pandemic, at nearly 21%, followed by a slight dip and then stabilization around 18% in the most recent years. Admission rates stayed relatively strong throughout the period, consistently above 65%, and peaked at over 80% in 2019.
The most striking pattern appears in enrollment percentages. After modest figures in 2017 and 2019, enrollment dropped to 0% from 2020 through 2023, before slightly rebounding to 3.37% in 2024. This shows that even though students from these schools are applying to and getting accepted by UNH, very few are enrolling, especially in the years following the onset of the pandemic. The slight increase in 2024 may signal the beginning of a recovery, but the overall gap highlights barriers for students from high-eligibility districts.
Figure 5
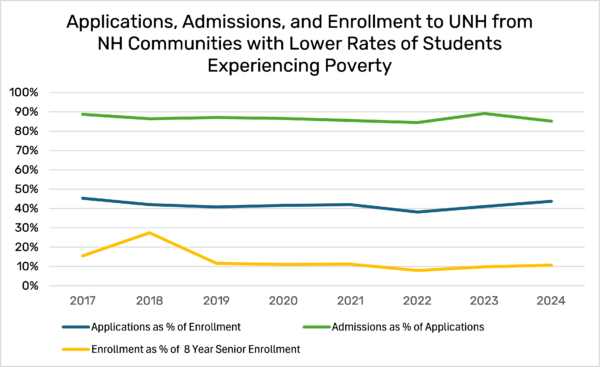
In contrast, Figure 6 shows New Hampshire high schools with the lowest enrollment in Free and Reduced Price Lunch programs. Windham High School, Hollis Brookline High School, Bow High School, Bedford High School, and Exeter High School all had FRL eligibility under 8%.
The graph shows consistently higher levels of engagement in the UNH admissions pipeline. From 2017 to 2024, application rates from these schools hovered between 38% and 45% of the graduating class, more than double the rates seen in the sample of high-eligibility schools. Admission rates remained strong and stable, consistently in the mid-to-high 80% range. Most notably, enrollment rates from low-eligible schools were significantly higher throughout the entire period, ranging from 7.94% to 27.46%, compared to years of 0% enrollment from their higher-eligibility counterparts. This steady engagement—across applications, admissions, and actual enrollment—illustrates a more direct and successful pathway from high school to college and reflects the structural advantages that students in lower-eligibility communities often have access to.
Figure 6
Conclusion
The data in this paper reveal that students from New Hampshire high schools with higher eligibility for FRL are less likely to apply to, be admitted to, and enroll at the University of New Hampshire than those from schools with lower eligibility. Although admission rates are relatively consistent across school types, lower application and enrollment rates suggest that the most significant barriers occur before and after the admissions decision.
Structural factors such as limited access to college counseling, fewer academic and extracurricular opportunities, and a lack of exposure to postsecondary pathways may contribute to lower application rates. For those who are admitted, non-academic barriers—particularly financial constraints—likely influence the decision not to enroll.
These enrollment patterns intersect with broader affordability challenges. UNH has one of the country’s highest in-state tuition rates; when additional fees, housing, and living expenses are included, the total cost of attendance exceeds $38,000 per year in 2024. New Hampshire consistently ranks last among U.S. states in public funding for higher education per student, a factor that contributes to elevated tuition and limited institutional aid.
Together, these dynamics suggest that both K–12 and higher education systems face structural inequities that shape college access in New Hampshire. Understanding and addressing these patterns is critical to ensuring more equitable postsecondary outcomes.
Download a copy of this report
Table 1
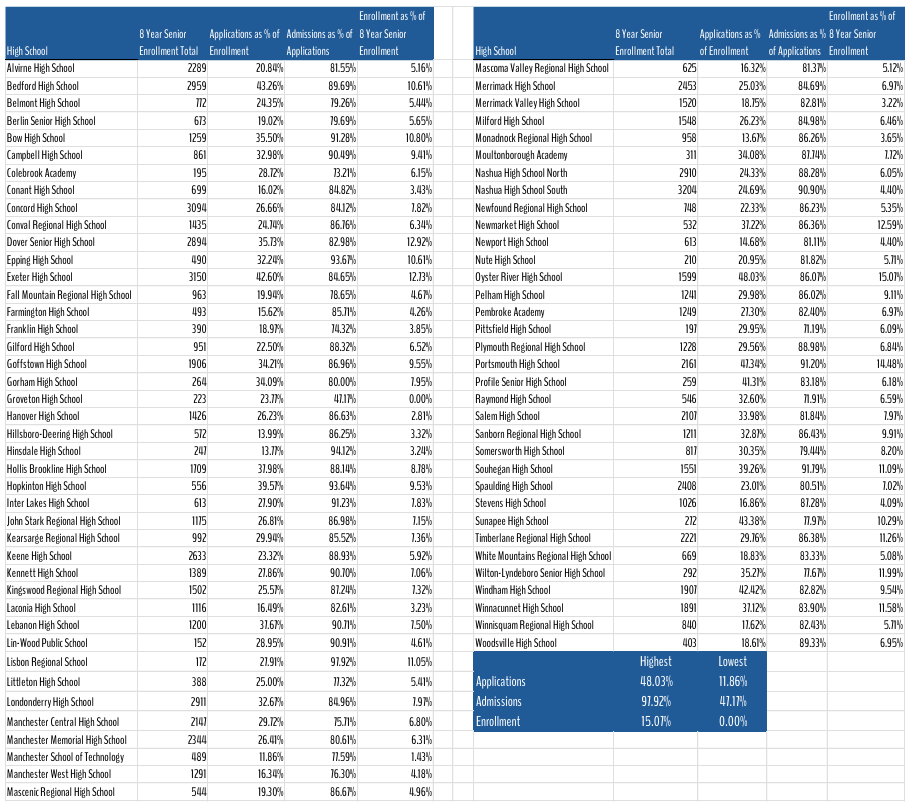
Table 1 lays out all NH High Schools Applications, Admissions, and Enrollments as described in the definitions section of this report.