
December 2022
Summary
The College Board’s SAT results are used by the state of New Hampshire as a measure of student achievement at the high school level. The test is administered to nearly every public school student in the spring of their junior year. We analyzed the average scores of students for each high school. We added together the results for the graduating classes of 2018, 2019, and 2020. Using multiple years reduced the normal variation seen in average scores, especially for smaller schools. Altogether there were 37,100 test-takers in our analysis. When Evidence-Based Reading and Writing (ERW) and Mathematics scores are combined, scores range from 400 to 1600.
Key Findings:
- Among New Hampshire’s public school students, the average score was 1043 for the class of 2018, 1038 for the class of 2019, and 1035 for the class of 2020.
- Among the seventy-nine high schools for which we had scored, the average student score over 3 years was the lowest at Manchester West High School (905) and the highest at Hanover High School (1283).
- High schools with a higher percentage of low-income students (as measured by the percentage of students eligible for free and reduced lunch) tend to have lower scores.
- In general, school size is not related to average scores. However, all nine schools with an average score below 950 were small schools with fewer than 420 test takers over the three years. No schools with more than 420 test takers had an average score below 950.
- Students in high schools in property-poor districts (equalized property value per student below $900,000) had lower average scores than those with higher property values per student.
- For a few schools, the number of test-takers was considerably below the number of reported 11th-grade enrollment. The reason for the missing students is not known.
Background
New Hampshire has designated the College Board’s SAT exam as a required test to measure achievement in reading, writing, and mathematics among 11th-grade students in our public schools. The tests are given in the spring of students’ junior year.
The College Board publishes reports the following fall and is placed on the NH Department of Education (DoE) website.[1] Those reports are for students in that year’s graduating class. For example, students who took the test in the spring of 2019 will be the graduating class of 2020 and their scores were reported in the College Board’s 2020 report for New Hampshire.[2]
While the number of students enrolled as seniors in the fall at a high school is typically close to the number of students who took the SAT the prior spring, there are always some students who have been unable to take the test for a variety of reasons. For example, some students may have transferred to or from that high school in their senior year. The number of graduates in each class will also differ from the number of test-takers the prior spring.
Table 1
| Graduating Class | Spring Junior Year SAT Test-takers | Senior Year Fall Enrollment | Graduates |
| 2018 | 12,738 | 12,766 | 12,348 |
| 2019 | 12,324 | 12,826 | 12,110 |
| 2020 | 12,038 | 12,751 | 12,028 |
It is not fair to compare any NH high school’s score with the national average score or students’ average scores in many other states. In many states, taking the SAT test is an option, not a requirement. In those states, the students who take the test are primarily those who plan to attend college. By testing only college-bound students, those states will have higher average scores than New Hampshire, where nearly all high school seniors take the test.
Resulting Scores
The SAT consists of two parts. The Evidence-Based Reading and Writing (ERW) test and the Mathematics test. Each part is scored separately in a range from 200 to 800. Therefore, the total range is from 400 to 1600. This report will use the total scores and not distinguish between the two portions of the test. While there are known national and statewide differences in average scores among genders and racial groups, those numbers are not published separately for each New Hampshire high school; thus, we cannot analyze them at the school level.
Using Results from Multiple Years
High schools with small graduating classes will have a small number of test-takers in their junior year. The average SAT scores for small schools will therefore have greater statistical variation from year-to-year than the average scores of larger schools. Table 2 illustrates this.
Table 2
| Gorham | Nashua South | |
| Average SAT test-takers per year | 28 | 359 |
| Average SAT score class of 2018 | 1,093 | 1,016 |
| Average SAT score class of 2019 | 996 | 1,019 |
| Average SAT score class of 2020 | 1,046 | 1,013 |
| Combined 3-year Average SAT score | 1,047 | 1,016 |
Using only the scores from one year may overestimate or underestimate the success of students at small schools. Mean scores may vary by as much as 10% from year to year as they did for Gorham High School. In larger schools, the annual variation will be 4% or less.
When we combine the three years 2018, 2019, and 2020 we smooth out these variations and the result is a fairer estimate of the average performance of students in small schools.
Figure 1
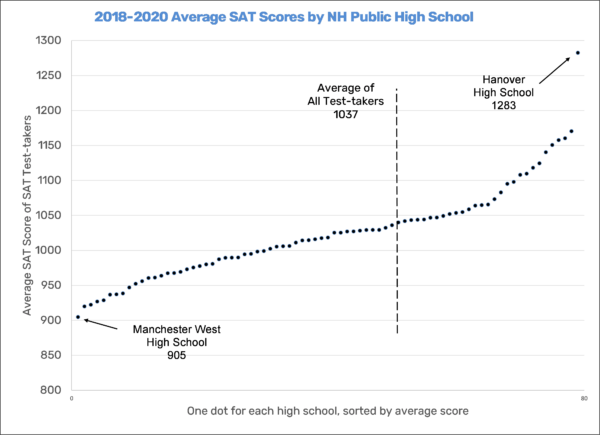
The average scores over the three years (2018-2020) of 79 public high schools are sorted from the lowest to highest and plotted in Figure 1. Pinkerton Academy had an average score of 1036 and thus was the high school closest to the overall average.
Scores and Low-Income Families
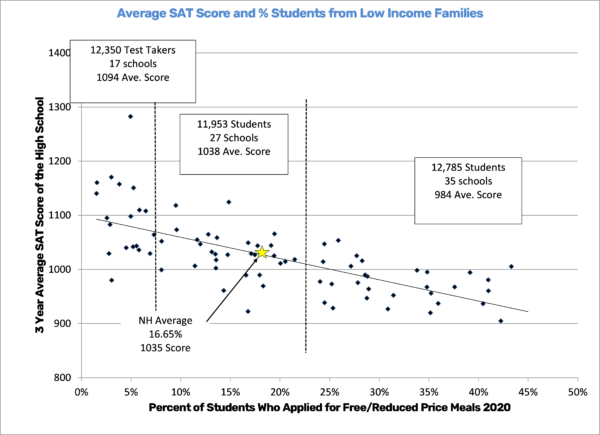
Figure 2 shows the 79 public high schools sorted from left to right by the percentage of low-income students in the 2019-20 school year. The downward-sloping trend line shows the tendency of schools with a higher percentage of students from low-income families to have lower average scores.
The 79 schools are divided into groups with nearly the same number of test-takers in each group as possible. One group of 17 schools each had fewer than 6.5% of their students from low-income families. The 12,350 test-takers from those schools had an average score of 1094. The second group of 27 schools each had between 6.6% and 19.1% of their students from low-income families. The 11,953 test-takers from those schools had an average score of 1038. The third group of 35 schools each had more than 19.1% of their students from low-income families. The 12,785 test-takers from those schools had an average score of 984.
Within each group, there are important differences.
In the 0%-6.5% group, the 537 test-takers at Hanover High School (4.9% low income) had a mean score of 1283 while the 439 test-takers at Sanborn Regional High School (3.0% low income) had a mean score of only 980.
In the 6.5%-19.1% group, the 427 test-takers at Lebanon High School (9.5% low income) had a mean score of 1118 while the 95 test-takers at Nute High School (16.8% low income) had a mean score of only 922.
In the 19.1%-45.0% group, the 127 test-takers at Moultonborough Academy (19.4% low income) had a mean score of 1066 while the 417 test-takers at Manchester West High School (42.48% low income) had a mean score of only 905.
Figure 2
School Size and SAT Results
Figure 3 displays one dot for each high school. The number of test-takers over the three years is displayed on the horizontal axis and the average SAT score among those students is displayed on the vertical axis. As seen in figure 3, there is only a small correlation between school size and average SAT scores. Small schools and large schools may have nearly identical average scores. Schools of the same size may have widely different average scores.
Figure 3
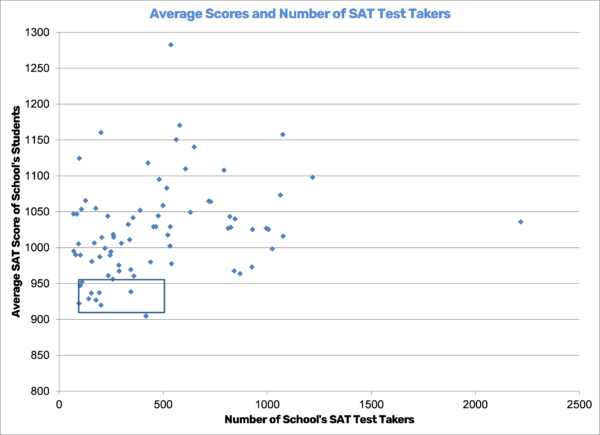
Table 3
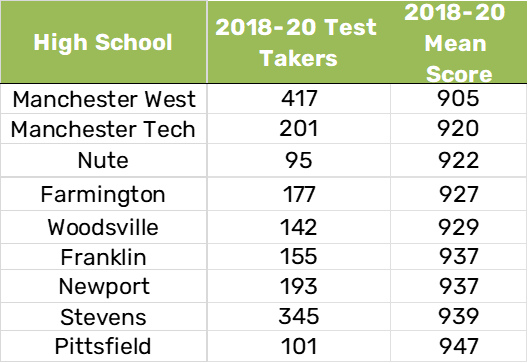
However, Figure 3 also shows that all nine schools with average scores below 950 are among the smaller schools with fewer than 420 test-takers. No schools with more than 420 test takers had an average score below 950.
Table 3 lists the 9 schools within the box in Figure 3.
SAT Scores and Property Wealth of the School Districts
Figure 4 displays one dot for each high school. The taxable equalized property value available to support each student in the district of the high school in 2020 is displayed on the vertical axis. The average SAT score among those students is displayed on the horizontal axis.[3]
Figure 4
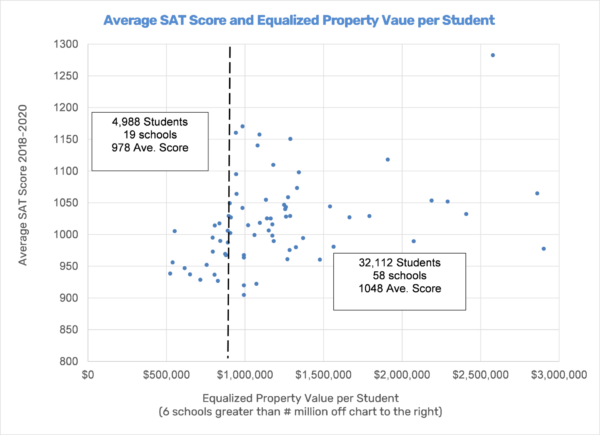
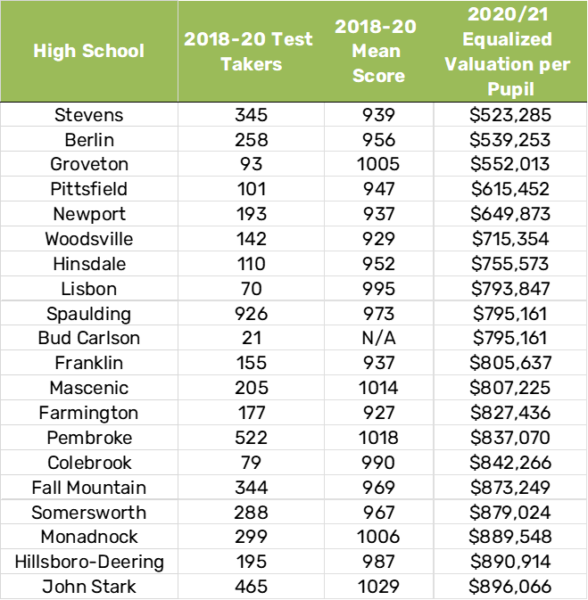
The average SAT result for all 79 high schools over the three years was 1037. Among the nineteen high schools with the least equalized property value per pupil, all below $900,000 per student, not one had an average score equal to the state average or better. These nineteen schools are all listed in Table 4.
Table 4
11th Grade Enrollment and Test-takers
Because the SAT is a required test for students the number of test-takers should be close to the number of students in their class in each high school.
Figure 5
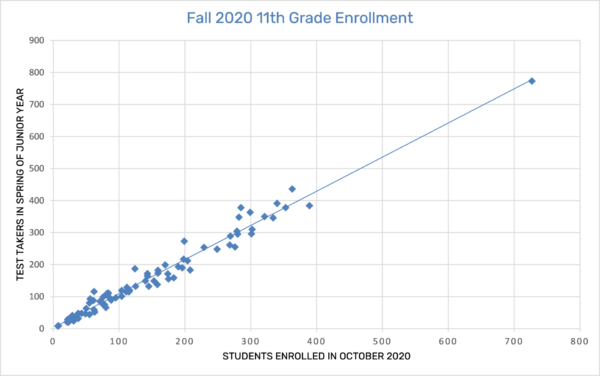
We have added the number of students taking the SAT in the spring of their junior year for the graduating classes of 2018, 2019, and 2020. We have also added the number of students enrolled in 11th grade in the fall of their junior year. In Figure 5, the straight line indicates the positions where the number of test-takers exactly equals the number of students enrolled in the fall. Some slight differences are expected. Students with disability or other unique circumstances are exempted from the test. Students who transfer in or out of a school between fall enrollment and the time the SAT is administered will affect these numbers as well. Most schools fall close to that line.
Table 5
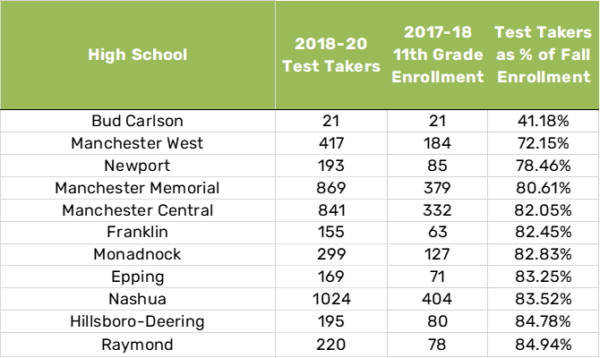
Table 5 lists the eleven schools where the number of test-takers in the spring of their junior years was fewer than 85% of the enrollment in the fall of their junior years. At least 15% of the students enrolled as juniors in the fall of 2017, 2018, and 2019 did not take the SAT in the spring of that school year.
The reason for this is unclear.
Conclusion
Through this analysis, we can find several patterns among SAT takers and the different high schools they may attend. Most notably, students taking the SAT who attend schools with higher percentages of low-income students (as measured by those who qualify for free and reduced lunch) and schools with less than 450 test takers have on average lower scores than schools in larger, wealthier communities. In the clearest example of this, we found that Manchester West High School had the lowest average score over the three years. Manchester West has the highest population of low-income students in the state. On the other hand, Hanover High School had the highest average over the three years.
From this, it appears that to increase the overall performance of students taking the SAT, appropriate funds must be distributed to schools with higher percentages of students who qualify for free and reduced lunch and communities with lower property values. Each New Hampshire student should have access to the resources needed to excel in whatever field they would like. Whether that be post-secondary education, the trades, or other workforce opportunities. Performance on the SAT may be just one measure of student success, but it can serve as an indicator of the need for school districts.
Click here to download the full data set.
Footnotes:
[1] https://www.education.nh.gov/who-we-are/division-of-educator-and-analytic-resources/bureau-of-education-statistics/non-statewide-assessment-college-board-reports
[2] The College Board does not report results for schools with fewer than 10 test takers. For this reason, results from Bud Carlson Academy in Rochester and Pittsburg School in Pittsburg are not included in their tables or our analysis. Rivendell Academy in Orford is part of an interstate school district for which the NH Department of Education does not publish enrollment data. For that reason, it is also excluded from this analysis.
[3] Pinkerton Academy, Coe-Brown Northwood Academy, and Prospect Mountain High School not included because DoE does not publish equalized valuation per pupil for those unique situations. Five schools are included in the calculations but are off the chart to the right because they have equalized property values that exceed $3 million per student.