
School Funding and Special Education: It’s Getting Worse
By Carly Prescott, March 2024
One of public education’s main purposes is to “promote student achievement and preparation for global competitiveness by fostering educational excellence and ensuring equal access.”[1] Meaning, regardless of their race, gender, ethnicity, or disability. To meet the various needs of students around the state, disability programs, and Individualized Education Programs (also known as IEPs) are put into place to ensure that students’ unique needs are met at school. Beyond the core services set in place in our public schools, many students with disabilities and IEPs require additional resources and instruction. These resources are critical, but they are often costly, and due to low levels of state funding, largely fall to local property taxes to support.
In New Hampshire, during the 2022-2023 school year, 30,964 (19.67%) students received Special Education Services (ADM/R)[2]. With almost 1/5 of students receiving these services in schools and little upfront help from the state, many schools and towns struggle to meet the complex funding needs of their students. Even though funding for students with disabilities is included as part of the State of New Hampshire’s adequate education funding formula, only 17.47%, (1 percent less than last year) of the actual costs are covered by the state and federal governments. This results in the bulk of the services cost, just like other public education costs, downshifting onto local property taxpayers.
This report seeks to understand how New Hampshire’s communities and students are impacted by the state’s inequitable funding structure as it pertains to students with disabilities in public schools.
Key Findings:
- State and Federal Governments paid 17.47% of costs associated with Individualized Education Programs (IEPs) in 2023, which was one percent less than in 2022.
- In 2023, 60 New Hampshire public school districts spent over 25% of their total expenditures on IEP expenses.
- Benton School District spent 45.65% of its total expenditures on IEP expenses in 2023, the highest proportion in the State.
- The average additional cost to educate one student with an IEP in New Hampshire was $29,556 in 2023.
- The average cost to educate one student without an IEP in New Hampshire in 2023 was $18,419, 14% more than in 2022.
- Special Education Average Daily Membership (ADM) constantly changes, causing volatile costs.
- The State contributes, on average, $3,094 additional per student with an IEP, which is only 10.47% of the actual additional cost, and less than in 2022.
- Catastrophic Aid is only 3.7% of the total funding for disability services within New Hampshire’s public schools in 2023.
How is Special Education Funded Now?
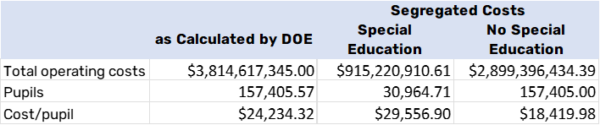
The total operating cost of the public schools in New Hampshire was $3,814,617,345 in 2022-23. In the same year, disability services expenditures reached $915,220,910, 24% (1% less than 2022) of the total cost of education in public schools. Like the rest of NH public schools, services for students with disabilities are funded largely by local property taxes.
According to data published by the Department of Revenue Administration (DRA) and Department of Education (DoE), on average, 70% of all revenues funding New Hampshire’s public schools come from local property taxes (including SWEPT). The other 30% of the revenues comes from the State and the Federal Governments.
The average cost to educate one student for the 2022-2023 academic year in New Hampshire was $24,234, including transportation. However, this figure does not show the reality for all students, especially those who require additional services, as they are included in the average.
The formula used by the State to determine the grants to schools and communities is based on the Average Daily Membership in Residence (ADM-R) of each community. The State contributed a base grant of $3,786 for every public school student. The State added $1,893 for students eligible for free and reduced-priced meals (FRL), an additional $2,037 for students with IEPs, an additional $740 for students who were English language learners, and an additional $740 for students below proficiency in 3rd grade reading. On average, the state paid 25% of the total cost to educate one non-IEP student yearly (about $4,900). The rest of the costs were picked up by other state grants, federal monies, and local property tax bills.
The most recent year’s average cost per pupil is an often-cited statistic. For 2022-2023 it was $24,234, including transportation. Once costs from IEPs are removed from school district spending, the average cost per pupil drops to $18,419. As shown in Table 1, IEPs add an average additional cost of $29,556.90 per identified student.
In Table 1, the costs of education per pupil are displayed. The DoE adequacy grant calculation spreadsheet for 2022-23 noted that 30,964 students received disability services (ADM/R). On average, the cost per pupil for these students was $47,976. This is $29,556.90 more per student than students without IEPs . It is important to note that this number hides a huge range. Some students with disabilities require only a few hundred dollars of additional services while others require out-of-district placements that may cost more than $100,000 per year.
Table 1
Breaking Down the Costs
The DoE annually prepares and publishes a table of revenue sources and distribution of expenditures for all school districts combined. The 2022-2023 report indicates that “Special Programs” cost $701,283,158, 19.4% of all expenditures. This does not mean that 19.4% of all school district costs are for special education.
“Special Programs” contains some expenses that are not related to special education. As the DoE accounting handbook states, “Special Education Programs are for students with disabilities, Special Programs is a broader category which also includes non-special education programs.” Those include costs for “culturally deprived”, bilingual, and gifted and talented programs of schools that might have them. Also importantly, “Special Programs” does not include other important extra costs associated with students who have IEPs. The accounting handbook also states that it does “not include expenditures for psychological services, speech and audiology, occupational therapy, and transportation services. These are reported as student support services and transportation services.”
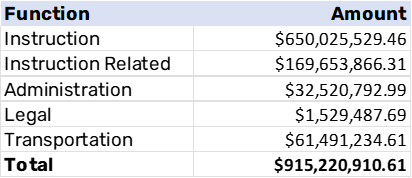
For 2022-23, the DoE report stated that total Special Education costs were $915,220,910.61. This is $213 million more than “Special Programs.” Table 2 displays the breakdown of total Special Education costs.
Table 2
How do we pay for it?
Federal regulations regarding students with disabilities, like the Individuals with Disabilities Education Act (IDEA), ensure free and appropriate public education for all children with disabilities. New Hampshire school districts receive aid from the Federal government and the State government to support their IEP programs. The table below displays the monies received by school districts that are not local revenues.
Every year, the DoE collects a DOE-25 spreadsheet from each district. The DOE-25 shows the total received and expended from government sources for 2022-23.
Table 3
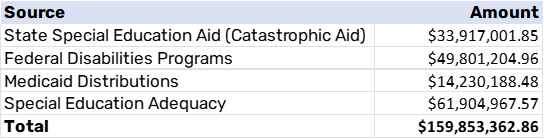
The remainder of the costs associated with IEPs, $755,367,547, was paid by the local school tax in each NH municipality. $69 million more than the previous year fell onto the local property taxpayer. The federal and state governments together paid only 17.47% of the total costs, most of which is a result of federal or state-mandated services. Local property taxpayers picked up the remaining 82.53%. On average, the State paid $3,094 per student with an IEP, just 6.45% of the total average cost.
These costs, however, are not evenly distributed among the districts and towns of the state. More than half of New Hampshire’s municipalities have below-average property tax bases. This means more than half of New Hampshire’s communities have a difficult time raising new revenues from their property taxes. Furthermore, individual IEP costs are volatile and hard to predict. For communities with tighter budgets, adjusting for these costs can be difficult.
Additionally, “State Special Education Aid”, also known as Catastrophic Aid, is reimbursed to schools for each student that costs 3.5 times the state average of $21,534 ($75,369), or more. Local school districts must meet these students’ immediate needs with no additional help from the state until the next year. Moreover, the $33,917,001.85, outlined in Table 3, has remained stagnant and does not meet the needs of all students whose services cost more than $75,369 each year. Catastrophic Aid accounts for only 3.7% of funding for IEP services.
Special Education Enrollment and Cost Volatility
Every community in New Hampshire has students with disabilities. Every year, the number of students with disabilities will change, and the scope of additional services can also change. Whether students graduate, move, or are diagnosed, the total cost of disability services changes yearly.
Just in the past 6 years, many school districts in the state have seen their special education expenditures rise or fall millions of dollars in one academic year. The dramatic and unpredictable changes in spending and enrollment are demonstrated in Tables 4-7 below.
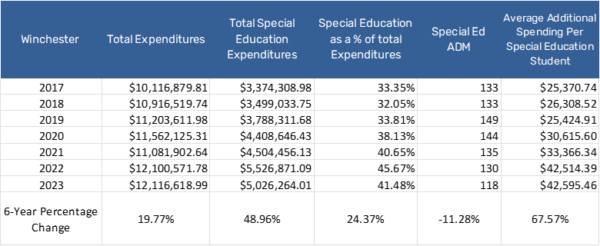
In Table 4, Winchester School District’s total budget in the last six academic years is compared to their special education expenditures. As seen in Winchester, the total spending for IEPs jumped over $2 million or 48% in 6 years. Winchester spent the second-highest percentage of its budget on disability services and had some of the state’s highest average additional costs. Even though Winchester had 12 fewer students with IEPs in 2023 than in 2022, the varying needs and costs of services are unpredictable. As seen, the total costs at Winchester grew just 19.77% while special education expenditures grew at a rate double that.
Table 4
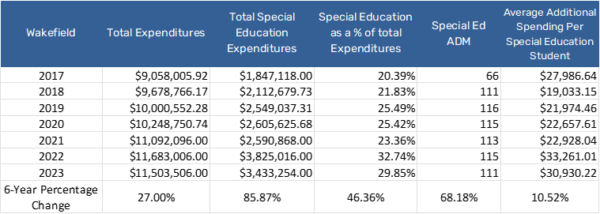
Across the state, Wakefield School District experiences some of the same difficulties. Like Winchester, Wakefield is a rather small district with roughly 500 to 600 students each year. As seen in Table 5 below, Wakefield’s special education expenditures increased by over $1 million between 2022 and 2023, causing costs to jump 11 percentage points up to 32% of the total budget. Moreover, between 2017 and 2022, disability service expenditures increased by 107%, much more than the total budget, which increased by only 29% in the same time frame. But, in 2023, Wakefield had 4 fewer students requiring additional services, and expenditures dropped around $400,000, or $3,000 per IEP student.
Table 5
While small and rural schools have a difficult time predicting their costs, larger urban schools can get hit hard by changing costs as well. However, economies of scale create lower costs per pupil and less likelihood for dramatic shifts in expenditures. For example, a student with an IEP moving to Concord will have a smaller impact on Concord’s budget than the same student moving to Winchester.
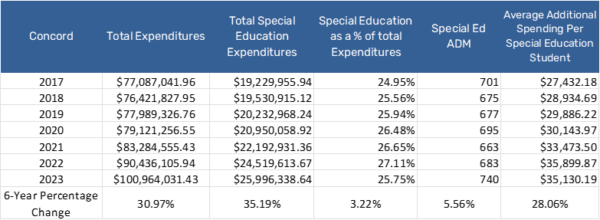
Tables 6 and 7 show the same data for Concord School District and Manchester School District. In Concord, the number of students with IEPs had been fluctuating but saw a sharp increase in 2023. In just 6 years, the average additional cost to educate one student with an IEP student jumped $8,000 and the percentage of total expenditures increased by 3.22%. Furthermore, for Concord, special education expenditures increased by 35% while Concord’s total expenditures increased by just 30%.
Table 6
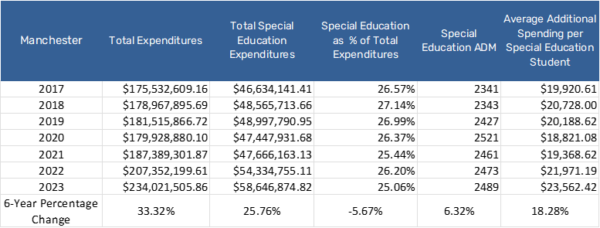
On the other hand, in Table 7, Manchester School District saw its largest Special Education ADM change of 170 students between 2017 and 2020. However, the district only saw a 16-student difference in their Special Education ADM in 2023. However, in 2018, Manchester spent the highest percentage of its total expenditures on disability services (27%). Unlike in Winchester, Concord, and Wakefield, IEP costs in Manchester did not prove to be as volatile during the last six years, mostly attributed to the size of the district.
Table 7
Who Spent the Most?
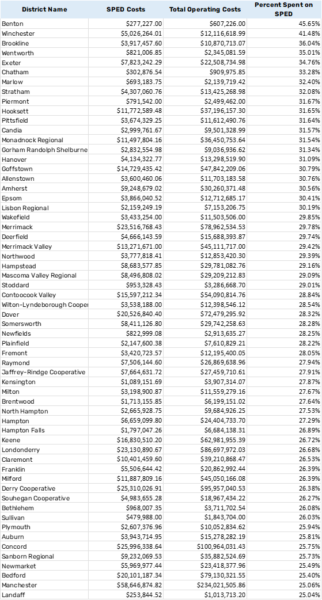
In 2023, the most recent year that data is available, 60 of the 162 or 37% of public school districts in New Hampshire had special education expenditures that exceeded 25% of their total budget.
Of the districts with the highest percentages of spending on IEPs, small schools, regional schools, cooperative schools, and larger city schools are represented. No matter the size, region, or enrollment, costs associated with disability services can be a large percentage of overall spending in a school district. Table 8 lists those 60 districts.
Table 8
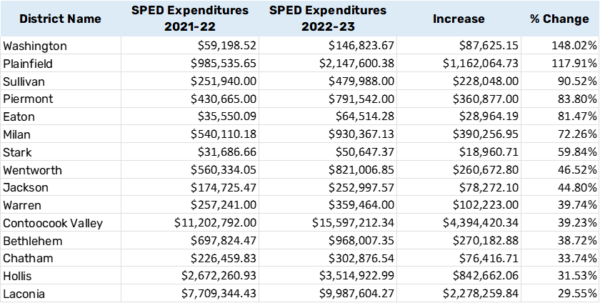
Which Districts Saw the Biggest Jump Between 2022 and 2023?
Of the 162 school districts in New Hampshire, 128 saw an increase in their special education expenditures. In Table 9, the 15 districts with the highest percentage increase in theirs are displayed. As seen, some of our smallest districts see the most extreme volatility year to year. Of this list, the only districts with a student population over 300 are Contoocook Valley, Laconia, and Hollis.
Washington School District’s special education expenditures increased by 148% in one academic year. School districts, school boards, and other administrative staff cannot prepare for such dramatic increases.
Conclusions
Students with disabilities have a federally protected right to public education. These students also deserve to not be seen as a financial burden to their local communities. While the cost to educate students with disabilities can vary widely, so can the ability of communities to pay for such services. Planning budgets around an ever-changing and unpredictable student population creates deep inequities for students and taxpayers alike.
With State and Federal governments covering less than 20% of the cost of disability services in our public schools, local school districts, and towns are tasked with not only making sure students have the proper resources but that those resources are paid for. Each of New Hampshire’s communities has vastly different abilities to raise revenues for their schools and students. The state’s downshifting of financial responsibility to the local property taxpayer puts a strain on local communities and creates inequitable funding models and outcomes for students.
This report shows that the costs to educate students with disabilities are increasingly downshifted annually to local property taxpayers while the responsibility of the State continues to decrease.
Equitable public education funding in New Hampshire could provide more stability for districts and equal opportunity for our students with disabilities. The different costs associated with providing each student federally mandated disability services are volatile and ever-changing. Exploring ways of shifting the $755,367,547 in special education expenditures currently shouldered by local property taxes back to the State could ensure all students with disabilities are equally and equitably provided for.
Source Documents
1) State Summary Revenue and Expenditures of School Districts 2021-2022
2) New Hampshire Financial Accounting Handbook for Local Education Agencies, revised 2001.
3) Costs as Reported on the DoE-25 Excel spreadsheet, page 21.
DOE-25_Aggregate_12-28-22.xlsx, cells A519-L-546
4) FY 2022 Adequacy Aid spreadsheet
5) FY 2021-22 State Average Cost Per Pupil
https://thf_media.s3.amazonaws.com/2022/2022_TheCriticalClassroom_FINAL_WEB.pdf
[1] DoE Mission Statement
[2] Average Daily Membership in Residence